My iPhone’s Screen Time is gaslighting me
Two weeks ago, my friends and I started a competition to reduce our phone usage. Each morning, we’d share screenshots of our iPhone Screen Time, and whoever spent the most time had to pay up. We all love to talk about how much we scroll on social media and how we want to be more intentional with our screen time. I’ve even written about it before.
Putting money on the line made things real. I started being more mindful about picking up my phone. If I could do a task on either my computer or phone, I chose the computer. I was far less prone to doomscrolling there. When I tried doing this alone in the past, it was easier to make excuses (after all, I don’t want to give up social media entirely).
Then the results came in. Although I managed to cut my screen time by about 10-20%, it was nothing compared to my friends. While I was still around 4-5 hours a day, they were usually in 3-4 hour range, some even reached 2.
But here is the strange part: when I looked at the breakdown Screen Time gave me, the numbers didn’t add up.
Take the data from last Wednesday, the day I started to get suspicious. I spent 4 hours and 57 minutes on my phone according to the total usage bar:
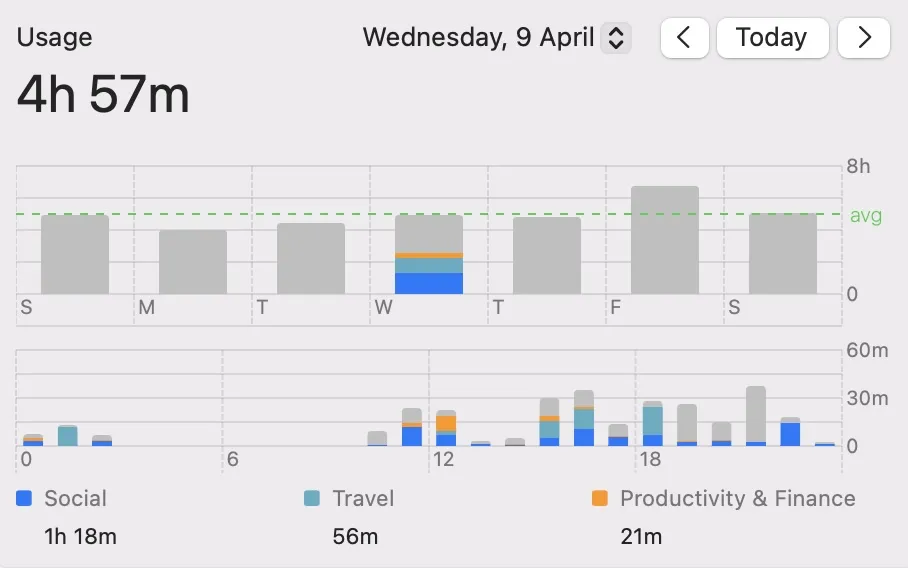
Below the bar graph are the top three categories, and here is the full breakdown the app shows:
| Categories | Time |
|---|---|
| Social | 1h 18m |
| Travel | 56m |
| Productivity & Finance | 21m |
| Other | 7m |
| Utilities | 6m |
| Information & Reading | 5m |
| Entertainment | 3m |
| Creativity | 3m |
| Education | 32s |
| Games | 1s |
I’ll save you the math - it add up to 2 hours, 59 minutes and 33 seconds. That’s nearly two hours less than the reported total time! This gap seemed consistent across several days, while some days had an even bigger difference. What’s going on?
If you look at the bar graph, the top three categories are color-coded. This raises the obvious question: what are the gray parts? Sure, some of that is from the other categories, but the numbers still don’t add up.
My partner suggested it might be the iPhone’s always-on display. At first, I thought, no way. Yes, the screen is technically on, but I’m not actually using it. Maybe I glance at it occasionally, but that’s not real usage. Still, since money was at stake and the situation didn’t seem to change after a few days, I decided to test it. I turned off the always-on display before going to bed and waited for the next day:
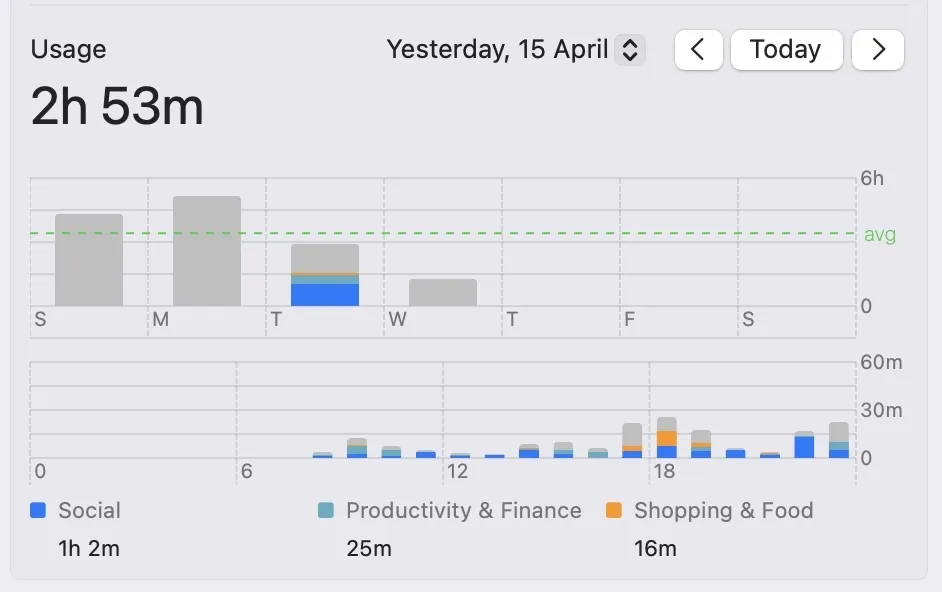
That looks more reasonable. The always-on display does seem to count significantly toward my screen time! But that wasn’t the end. Here is the full breakdown again:
| Categories | Time |
|---|---|
| Social | 1h 2m |
| Productivity & Finance | 25m |
| Shopping & Food | 16m |
| Information & Reading | 11m |
| Other | 8m |
| Entertainment | 6m |
| Health & Fitness | 4m |
| Travel | 1m |
| Utilities | 55s |
| Creativity | 37s |
That adds up to 2 hours, 14 minutes and 32 seconds - there is still 39 minutes of difference! Looking at the graph, most of the gray bars were around 5-7 p.m. and 11 p.m. Trying to remember what I did during those hours: between 5:30pm-6:30 p.m. I was at the gym and was listening to music, and around 11 p.m. I was also air-playing some music while sitting in the living room. None of that involved me actively using my phone, just music in the background.
Could background music playback be counted as screen time? Looks like it. 1
At that point, it felt unreasonable. When always-on display was included in my screen time, I said okay, I can disagree but this is technically screen time. Background music, though? I am not using the screen at all!
Three final points:
- I like always-on display. Even though it adds to my (fake) screen time, I turned it back on.
- I am using way less screen time than I thought. Still more than I’d like, but not as bad.
- Until AI takes over the world (not), we still have the right to question software when it doesn’t make sense. Sometimes, we’re right.
Reply via email
This is also suggested in this Reddit post comment section, alongside some other suggestions which I believe are wrong.↩